Apr 22, 2014 // by Athena // Blog, Earth System // Comments Off on 2014 Sino-UK Coevolution of Life and the Planet Summer School
Encouraged by the success of our Spring School in 2012 and 2013, this year we coorganise with Nanjing Institute of Geology and Palaeontology the Coevolution of Life and the Planet Summer School in China. The summer school will be in the beginning of July and in Nanjing.
The Summer School is aimed at graduate students and early career postdoctoral researchers, primarily the ones involved in sponsors’ projects, namely the 973 Coevolution Project of Chinese Ministry of Science and Technology, Nanjing State Key Laboratory of Palaeobiology and Stratigraphy and NERC “Life and the Planet” Research Programme. But enquires by those outside the programme/projects are also welcome.
The purpose of the Summer School is to provide students with an overview of state-of-the-art and hands-on palaeoenvironmental research. Course tutors are all senior researchers working actively in various earth science disciplines from the UK and China.
The 2014 School lasts in total 7 days. Day 1 and Day 4-7 will be held at the Nanjing Institute of Geology and Palaeontology, Day 2-3 a short field trip will be carried out near Nanjing. Read the outline for the course here
May 13, 2013 // by Athena // Blog, Earth System // Comments Off on When was CO2 last at 400 ppm? And what was the climate like?
Paul N. Pearson, School of Earth and Ocean Sciences, Cardiff University CF10 3AT, UK. Email:[email protected]Summary Atmospheric CO2 is approaching the 400 ppm mark for the first time in human history which begs the question: when was it last that high? A recent high profile suggestion is that CO2 was that high in the Pliocene epoch (approximately 2.6-5.3 million years ago) and this is now being repeated in the press and around the internet. Here I point out that this claim is based on a few extreme estimates, mostly from sites that systematically overestimate more recent CO2 levels, while the majority of published Pliocene CO2 values are in the 250-400 ppm range. The last time we have consistent evidence for pCO2 over 400 ppm is in the Early Oligocene epoch more than 26 million years ago. This post presents the key graphs and comments on some of the methods used to calculate past pCO2.
Read the article
Download the article (pdf)
Images and graphs are subject to copyright.
May 7, 2013 // by Athena // Blog, Earth System // Comments Off on Bristol University: Oligocene discussion day
For many years the Oligocene has received little attention from the Cenozoic palaeoclimate community. This event hopes to promote awareness of the Oligocene (34-23 million years ago)and encourage future research within this field.
On the 16th of May, Bristol University will be hosting a full day event dedicated to the discussion of the Oligocene
Programme
10.30 -10.45: Welcome
10.45 -11.15: Ellen Thomas (Yale/Bristol)
11.15 -11.45: Diederik Liebrand (NOC)
11.45 -12.00: Gordon Inglis (Bristol)
12.00-13.00: Lunch
13.00-14.00: Bridget Wade (Leeds) Oligocene
14.00-15.00: Discussion for Phds and PDRAs
15.00-16.00: Optional seminar in Earth Science by Kirsty Edgar concerning the middle Eocene (G25)
16.00 – onwards: Drinks/dinner
All events, except for Bridget’s departmental seminar, will be held in Seminar Room 2, Geographical Sciences.
Bridget’s talk will be held in the Peel lecture theatre in Geographical Sciences.
Feb 26, 2013 // by // Earth System, Education // Comments Off on Eleni’s “Icehouse” class at Bowdoin College
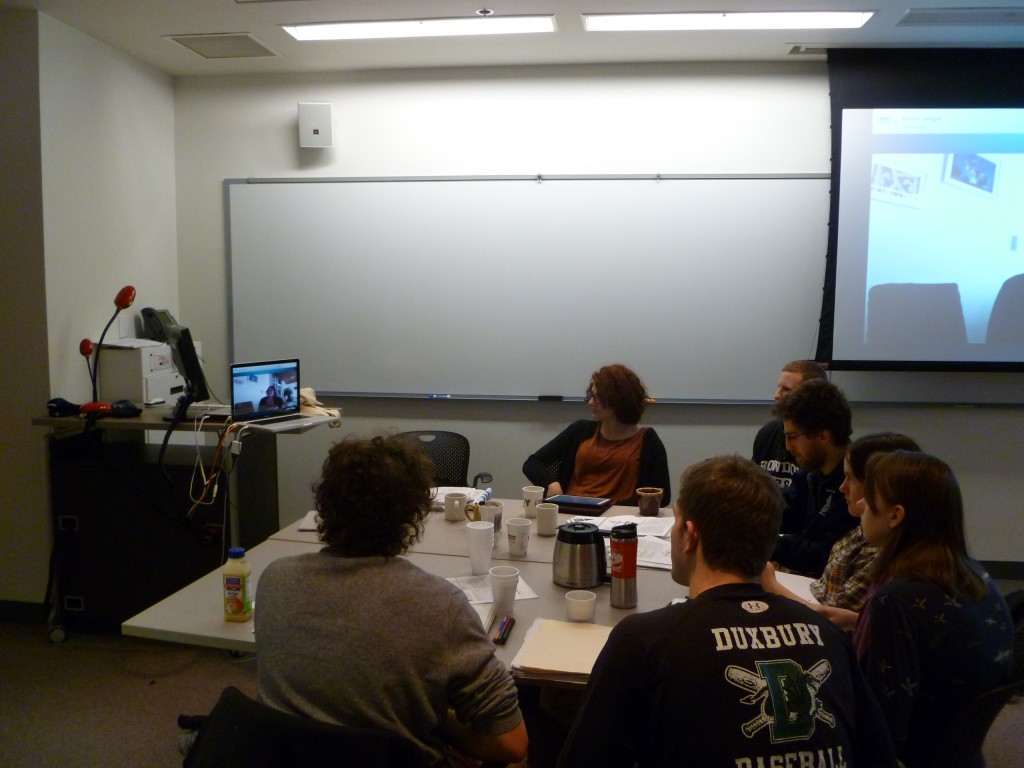
A few days ago I had the opportunity to lead a discussion on the Descent into the Icehouse in Dr. Michéle LaVigne’s upper level undergraduate course, ‘Earth climate history’ at Bowdoin College (Brunswick, ME, USA). During the class, which was arranged as a video conference, the students discussed a selection of literature related to the Descent into the Icehouse project (Pearson et al. 2009, Bijl et al. 2009, Beerlingand Royer 2011).
We had a lively discussion and several issues have been raised, some of the most interesting ones were:
The timescales of global climate change are very different between early Cenozoic and future predictions; how does understanding the Cenozoic help us predict the future?
Ice caps seem to show a nonlinear response to climate forcing during melting due to a hysteresis effect, but will this hold true on current time scales? Could this response eventually manifest itself into hastened melting as opposed to persistence of ice caps?
On early Cenozoic time scales, how much does the distance of the Earth’s orbit from the sun implicate atmospheric CO2 levels and how much of that theory is guesswork?
The most intriguing point to me was the question if the change in sea surface temperature was due to decline carbon dioxide concentrations, why/how did the tropics remain fairly stable during the Eocene? What are the possible mechanisms such as different ocean circulation, different atmospheric circulation, or something having to do with the uneven radiation from the sun based on latitude?
Well…. the answer to this question will have to wait until we have generated more data…
Overall, it was a great experience that I would certainly do again.
Feb 7, 2013 // by Athena // Blog, Earth System // Comments Off on Coevolution of Life and the Planet Spring School 2013
Biogeochemical Cycles and Evolution
The 7-day 2013 NERC “Life and the Planet” Spring School will be held in Exeter during 14th-21st April, 2013. The school is composed of a short field trip, a two-day GENIE modelling workshop and three days of seminars! The Spring School is mainly aimed at the postgraduate students and postdoctoral researchers involved directly in the programme. Other students can be accepted in exceptional cases.
More information please click. If you have any question, please contact the Programme manager
Ying Shields-Zhou
Department of Earth Sciences
University College London (UCL)
Gower Street
London, WC1E 6BT
Email:[email protected]
Tel: +44 (0) 207 679 2146
Fax:+44 (0) 207 679 2433
…………………………………………
There is another NERC Spring School around the same time in April, 2013. The two weeks school is organised by NERC Programme ES4 (Earth System Sciences Spring/Summer School) and will be held in Edinburgh! For more detail, please go to ES4 Spring School 2013!
ES4 is open to NERC funded PhD students and researchers in the first instance.
Jan 3, 2013 // by Athena // Blog, Earth System // Comments Off on New study documents the natural relationship between CO2 concentrations and sea level
By comparing reconstructions of atmospheric CO2 concentrations and sea level over the past 40 million years, researchers based at the National Oceanography Centre, Southampton have found that greenhouse gas concentrations similar to the present (almost 400 parts per million) were systematically associated with sea levels at least nine metres above current levels.
The study determined the ‘natural equilibrium’ sea level for CO2 concentrations ranging between ice-age values of 180 parts per million and ice-free values of more than 1,000 parts per million.
It takes many centuries for such an equilibrium to be reached, therefore whilst the study does not predict any sea level value for the coming century, it does illustrate what sea level might be expected if climate were stabilized at a certain CO2 level for several centuries.
Lead author Dr Gavin Foster, from Ocean and Earth Science at the University of Southampton which is based at the centre, said, “A specific case of interest is one in which CO2 levels are kept at 400 to 450 parts per million, because that is the requirement for the often mentioned target of a maximum of two degrees global warming.”
The researchers compiled more than two thousand pairs of CO2 and sea level data points, spanning critical periods within the last 40 million years. Some of these had climates warmer than present, some similar, and some colder. They also included periods during which global temperatures were increasing, as well as periods during which temperatures were decreasing.
“This way, we cover a wide variety of climate states, which puts us in the best position to detect systematic relationships and to have the potential for looking at future climate developments,” said co-author Professor Eelco Rohling, also from Ocean and Earth Science at the University of Southampton.
The researchers found that the natural relationship displays a strong rise in sea level for CO2 increase from 180 to 400 parts per million, peaking at CO2 levels close to present-day values, with sea level at 24 +7/-15 metres above the present, at 68 per cent confidence limits.
“This strong relationship reflects the climatic sensitivity of the great ice sheets of the ice ages,” said Dr Foster. “It continues above the present level because of the apparently similar sensitivity of the Greenland and West Antarctic ice sheets, plus possibly some coastal parts of East Antarctica.”
According to the study, sea level stays more or less constant for CO2 changes between 400 and 650 parts per million and it is only for CO2 levels above 650 parts per million that the researchers again saw a strong sea level response for a given CO2 change.
“This trend reflects the behaviour of the large East Antarctic ice sheet in response to climate changes at these very high CO2 levels. An ice-free planet, with sea level 65 metres above the present, occurred in the past when CO2 levels were around 1200 parts per million.”
Professor Rohling said, “Sea level rises to these high values will take many centuries, or even millennia, but the implications from the geological record are clear – for a future climate with maximum warming of about two degrees Centigrade, that is with CO2 stabilized at 400 to 450 parts per million, sea level is set to steadily rise for many centuries, towards its natural equilibrium position at around 24 +7/-15 metres, at 68 per cent confidence. In Intergovernmental Panel on Climate Change terms, this is a likely rise of at least nine metres above the present. Previous research indicates that such rises above present sea level may occur at rates of roughly one metre per century.”
Based on these results, which document how the Earth system has operated in the past, future stabilization of CO2 at 400-450 parts per million is unlikely to be sufficient to avoid a significant steady long-term sea level rise.
Nov 19, 2012 // by Athena // Blog, Earth System // Comments Off on Scientists develop new approach to support future climate projections
Descent into the Icehouse members Gavin Foster and Dan Lunt, as part of the multinational Palaeosens project lead by Professor Eelco Rohling, have re-evaluated published estimates of prehistoric climate sensitivity. The results of this are published in Nature today. This is the press release that can also be found on the University of Southampton’s website
Scientists develop new approach to support future climate projections
Scientists have developed a new approach for evaluating past climate sensitivity data to help improve comparison with estimates of long-term climate projections developed by the Intergovernmental Panel on Climate Change (IPCC).
The sensitivity of global temperature to changes in the Earth’s radiation balance (climate sensitivity) is a key parameter for understanding past natural climate changes as well as potential future climate change.
Many palaeoclimate studies have measured natural climate changes to calculate climate sensitivity, but a lack of consistent methodologies produced a wide range of estimates as to the exact value of climate sensitivity, which hindered results.
Now a team of international scientists, including Eelco Rohling, Professor of Ocean and Climate Change at the University of Southampton, have developed a more consistent definition of climate sensitivity in prehistoric times. When the scientists evaluated previously published estimates for climate sensitivity from a variety of geological episodes over the past 65 million years, they found that the estimates varied over a very wide range of values, with some very high values among them (high values would imply a very strong temperature response to a change in radiative forcing, for example, due to CO2 increase).
The team discovered that this wide range was almost entirely due to the fact that different researchers used different definitions. Similar to biologists needing taxonomy to ensure that they all talk about the same organisms, the scientists needed to develop a definition terminology that, applied to estimates from the past, makes those estimates compatible with estimates from climate models as used by the IPCC.
Professor Rohling, who is currently based at the National Oceanography Centre Southampton but will join the Australian National University next year, says: “Consistent intercomparison is a top priority, because it is central to using past climate sensitivity estimates in assessing the credibility of future climate projections.
“Once we had developed the framework and we had elaborated all the different assumptions and uncertainties as well, we applied it to climate reconstruction data from the last 65 million years. This caused a much narrower range of estimates, and this range was now defined in such a way that we could directly compare it with estimates in the IPCC assessment for their longer-term (several centuries) outlook.”
The scientists found that the likely range of climate sensitivity consistently has been of the order of -2.2 to 4.8 degrees C per doubling of CO2, which closely agrees with the IPCC estimates. Currently, atmospheric CO2 levels are around 392 parts per million (increasing by about 2.5 ppmv per year). Pre-industrial values were around 280 ppm, so that a doubling would therefore imply 560 ppm (at the current rate of emissions increase, this would achieve a doubling roughly around 50 to 70 years from now, but this depends strongly on the emissions developments).
Professor Rohling adds: “Our study only documents what the climate sensitivity has been over the last 65 million years, and how realistic the estimates of the IPCC are in that context. It finds that those estimates are fully coherent with what nature has done in the (natural) past before human-based effects. Hence, it strongly endorses the IPCC’s long-term climate projections based on such values: nature shows us it always has, and so likely will again, respond in a way close to what the models suggest, as far as warming is concerned.”
The research stems from a three-day Academy Colloquium attended by about 40 internationally renowned specialists in past and present climate studies, held at the Royal Netherlands Academy of Arts and Sciences in Amsterdam last year.
The findings are published in the latest edition of the journal Nature.
Notes to editors:
A copy of the paper ‘Making sense of palaeoclimate sensitivity’ is available from Media Relations on request.
The University of Southampton is celebrating its 60th anniversary during 2012.
Her Majesty Queen Elizabeth II, granted the Royal Charter that enabled the University of Southampton to award its own degrees in the early weeks of her reign in 1952
In the six decades to follow, Southampton has risen to become one of the leading universities in the UK with a global reputation for innovation through academic excellence and world-leading research.
This year, the University’s reputation continues to grow with the recent awarding of a Queen’s Anniversary Prize for Higher and Further Education in recognition of Southampton’s long-standing expertise in performance sports engineering. To find out more visit www.southampton.ac.uk/60
3. The National Oceanography Centre (NOC) works in partnership with the UK marine research community to deliver integrated marine science and technology from the coast to the deep ocean.
It was formed in April 2010 by bringing together the Natural Environment Research Council (NERC)-owned Proudman Oceanographic Laboratory in Liverpool and NERC-managed activity at the National Oceanography Centre, Southampton into a single institution.
With its partners, the NOC delivers the research capability needed to tackle the big environmental issues facing our planet. Research priorities include the oceans’ role in climate, sea level change and the future of the Arctic Ocean.
The University of Southampton and the University of Liverpool are hosting partners of NOC. Ocean and Earth Science at the University of Southampton shares a waterfront campus with the NERC-operated elements of the NOC, and a close collaborative relationship is maintained at both Southampton and Liverpool.
For further information contact:
Glenn Harris, Media Relations, University of Southampton, Tel: 023 8059 3212 email: [email protected]
A rare find of stunningly intact fossils of prehistoric plankton will allow researchers to study how the tiny marine organisms cope with rising acidity in the oceans.
Finding such intact specimens of coccolithophores, micrometre-sized marine plankton encased in discs of calcium carbonate, is a real coup — searching for fossils of calcified single-celled organisms often yields only skeletal bits that have fallen to the ocean floor.
Scanning electron microscope image of rock surfaces collected from the Bass River core in New Jersey. Image Credit: Paul Bown
“Breaking open undisturbed 56-million-year-old sediment samples, we can image coccolithophores — right down to their intracellular vesicles — using a scanning electron microscope,” said Paul Bown, a palaeoceanographer at University College London, who this week presented images of the fossils at the Third International Symposium on the Ocean in a High CO2 World in Monterey, California.
A growing concern among scientists is that ocean acidification, driven by climate change, will reduce the abundance of calcium carbonate in the seas, making it difficult for algae to form their microscopic plating, essential for their survival. With intact fossils in hand, researchers can compare the sizes, shapes, thickness and growth rates of ancient and modern coccolithophores.
Read the full article: Nature doi:10.1038/nature.2012.11500
Sep 3, 2012 // by Athena // Blog, Earth System // Comments Off on Climate change stories from the abyss
A team of scientists, including University of Southampton scientists who are based at the National Oceanography Centre, have shed new light on the world’s history of climate change.
The Pacific Ocean has remained the largest of all oceans on the planet for many million years. It covers one third of the Earth’s surface and has a mean depth of 4.2 km. Its biologically productive equatorial regions play an important role particularly to the global carbon cycle and long-term climate development.
During a four-month expedition of the Integrated Ocean Drilling Programme (IODP) on board the US drilling vessel JOIDES Resolution an international team of more than 100 scientists and technicians recovered 6.3 kilometers of sediment cores from water depths between 4.3 and 5.1 km and drilled 6.3 km of sediment cores at eight locations.
The cores offered an excellent archive of Earth’s history and showed how global climate development during the past 55 million years is mirrored and influenced by geochemical processes deep within the ocean.
The findings are published in the latest edition of Nature.
Figure: CCD and carbonate accumulation rate reconstruction compared with published benthic foraminiferal d18Oand d13C values and atmospheric CO2. a, Equatorial Pacific accumulation rate history as a function of geological age at the backtracked and unloaded palaeo-water depth, and using a palaeomagnetic polarity age scheme, plotted as black and white bars below the figure. Circle area is scaled by accumulation rate: carbonate accumulation rate (CAR; filled circles), total mass accumulation rate (MAR; open circles). Data are plotted with a lighter colour outside a63.5u band around the palaeo-equator.The position of the equatorial Pacific CCDis indicated by a solid red line (dashed red line marks reconstruction from off-equatorial sites).
Professor Heiko Pälike, of the University of Southampton and National Oceanography Centre, Southampton was co-chief scientist of the cruise and lead author of the Nature study.
He explains: “Nowadays we often discuss global warming induced by man-made carbon dioxide. However, on geological timescales of millions of years other processes determine the carbon cycle.”
Volcanoes are one major source of carbon dioxide input to the atmosphere. On the other hand the greenhouse gas is removed by weathering of rocks made up of carbonate.
“The overall balance of these processes is reflected in the deep ocean’s carbonate compensation depth, the CCD,” the MARUM scientist continues.
“This invisible surface is defined as the depth in the oceans at which the mineral calcite is dissolved. Hardly any biological remains made from carbonate below the CCD, for example chalk and microscopic plankton, are preserved. Instead the sediment that consists mostly of clay and plankton remains made from silica.
“The interesting point in our study is that the carbonate boundary is fluctuating over time. It shallows during periods of warm climate and normally deepens when ice age conditions prevail.”
In the study, Professor Pälike and co-workers demonstrate that in the equatorial Pacific the CCD was at 3.3 to 3.6km 55 million years ago. Between 52 and 47 million years ago, when very warm climate conditions prevailed, the CCD leveled up to 3 km. 34 million years ago, when the Earth slowly but steadily cooled and the first ice domes formed in Antarctica the CCD went down too. 10.5 million years ago it reached 4.8 km.
The cores drilled during the expedition strikingly demonstrate that the interplay of climate development and carbon cycle was not a one-way street at all.
“From 46 to 34 million years ago, when Earth turned into a permanent icehouse, our record reveals five intervals during which the CCD fluctuated upwards and downwards in the range of 200 and 900 metres,” Professor Pälike says. “These events, that often mirror warming and cooling phases, persisted between 250,000 and one million years.”
Similar episodes were registered in the sediment cores for later parts of the Earth’s history. 18.5 million years ago the CCD moved upward about 600 metres – only to sink down to 4.7 km 2.5 million years later. Today, the Pacific carbonate compensation depth is at 4.5 km.
…………………………………..
Heiko Pälike, Mitchell W. Lyle, Hiroshi Nishi, Isabella Raffi, Andy Ridgwell et al.
A detailed reconstruction of the calcium carbonate compensation depth—at which calcium carbonate is dissolved—in the equatorial Pacific Ocean over the past 53 million years shows that it tracks ocean cooling, increasing as the ocean cools.
Nature 488,609–614(30 August 2012)doi:10.1038/nature11360
Jul 31, 2012 // by Athena // Blog, Earth System // Comments Off on CO2 and climate closely linked during the middle Miocene (11 to 17 million years ago)
The Miocene epoch spans a relatively long period of Earth’s history from 5 million to 23 million years ago. It contains the middle Miocene Climatic Optimum (from around 17 to 15 million years ago, also known as the MCO for short) – a period of global warmth (perhaps as much as 4-5 oC warmer than today) punctuating the overall cooling trend that has characterised the last 50 million years. Notably, the MCO is associated with (amongst other things) a smaller than modern Antarctic Ice Sheet. This is therefore a very useful period to study as it may serve as an analogue for our warm future, or at the very least, as a vital guide to how the Earth system functions when it’s warmer than today.
The most obvious driver of warmth during the MCO would be higher CO2 than the pre-industrial period (i.e. >280 ppm). However, much of the available proxy information does not support this and the middle Miocene is thought to be a time period when other factors control climate independent of CO2 – such as ocean circulation and mountain uplift. In a recent paper, by Gavin Foster, Carrie Lear and James Rae published in Earth and Planetary Science Letters , a new boron isotope-based CO2 record is presented that, in contrast to this long standing view, shows a remarkable agreement with indicators of the thermal state of the Earth System during the middle Miocene, for instance, the oxygen isotopic composition of benthic foraminifera (which reflect ice volume and bottom water temperature) and the state of the Antarctic Ice Sheet (Figure 1). When the temperature component of the oxygen isotope record is isolated and corrected for, the record of ice volume (the amount of ice stored on land) generated appears tightly correlated to CO2 (see Figures 1 & 2). This suggests that CO2 is driving the climate system during the middle Miocene and the climate system and the cryosphere are responding in a relatively linear fashion to CO2 forcing – e.g. when CO2 goes up the climate warms and the ice sheets melt and vice versa.
Whilst this observation provides further support for the importance of CO2in driving natural climate change, it does leave us with a couple of conundrums. Firstly, it is known from a number of sources that the Antarctic was much warmer during the MCO (e.g., see My oh Miocene!) and the Antarctic Ice Sheet (AIS) retreated behind the current ice margin at this time. Our new data suggests that it did this at a similar level of CO2 (~350-400 ppm) to that associated with its regrowth at the end of the MCO (Figure 1). According to ice sheet models this shouldn’t happen, because the AIS is so cold, bright and elevated, that a higher CO2 (and hence more warmth) is required to melt it than is required to form it in the first place (a process known as hysteresis). The answer to this conundrum is that it is likely some portion of the AIS is more mobile than the models are able to simulate (e.g. those portions, such as the Aurora subglacial basin, currently below sea-level, see http://www.antarctica.ac.uk//bas_research/data/access/bedmap/examples/bed10.gif). This of course has potentially worrying consequences for our future as we approach Miocene-like CO2 levels in the coming years. Because ice sheets are inherently sluggish, it will take many 100s of years for the AIS to reach equilibrium with modern CO2 levels, but when it does we may also experience Miocene-like sea-levels (>20 m higher than present).
Secondly, even after the MCO, when our new record suggests CO2 dropped to lower than pre-industrial values (280 ppm; Figure 1), the Miocene is thought to be significantly warmer than the pre-industrial. In particular, several studies (including this recent one in Nature) indicate that climate cooled from the Late Miocene to the Pliocene (11 to 2.5 million years ago) – and if CO2 is already at low values, what is driving this cooling? Unfortunately CO2 records for the Late Miocene to Pliocene are sparse so we are not currently able to identify exactly what CO2 is doing during this period. This means it is still possible that CO2 and climate are decoupled for part of the Miocene. However we are in the process of generating some new boron based CO2 records for this crucial period so we may know the answer in the coming months – so watch this space!
FIGURES
CAPTION FIGURE 1. (a) Middle Miocene pCO2 (Foster et al., 2012), (b) benthic foraminiferal δ18O at ODP 761 (Lear et al., 2010) – this parameter reflects both the temperature of the deep water the foraminifera grew in and the amount of ice on land (ice volume), (c) δ18O of seawater (δ18Osw) reconstructed at ODP 761 (Lear et al., 2010) – this parameter is just ice-volume. (d) schematic summary of shore based reconstructions of the Antarctic Ice Sheet with the length of the black bands incorporating both dating uncertainties and the likely duration of events (Sugden and Denton, 2004; Rocchi et al., 2006; Lewis et al., 2006; Lewis et al., 2007; Lewis et al., 2008), (e) AIS size based on heavy mineral assemblage in the AND-2A drill hole, Ross Sea (Hauptvogel and Passhier, 2012), (f) accumulation rate of debris delivered to the North Atlantic by ice bergs (ice rafted debris; IRD) >0.5 mm in size (from Winkler et al., 2002) and (g) schematic Antarctic glacial history based on the results from the AND-2A drill hole, Ross Sea (Passchier et al., 2011). For (a) symbols are as for Figure 8 and for (b) and (c) symbols are as for Figure 5. Also shown in (g) is the average accumulation rate of IRD >0.5 mm (g/cm2/ka) at ODP Site 909 during the last 1 million years (0.13 g/cm2/ka). In (g) the white fill denotes time periods of expanded, cold-based AIS with advance beyond the modern grounding line beginning at ~14.7 Ma (black line) coincident with the start of the MMCT. Periods of polythermal conditions and a reduced AIS compared to the modern are shown as light grey and periods of significant retreat as dark grey (modified from Passchier et al., 2011).
CAPTION FIGURE 2. . The relationship between δ18Osw (which represents the amount of ice stored on land – ice volume) and climate forcing (δFCO2 = 5.35 * ln[CO2/278] W/m2) by pCO2. In each plot data from ODP 761 is shown as filled blue diamonds and ODP 926 as open blue triangles. Error bars are the sum of the analytical uncertainty in d11B, the uncertainty in TA and sea surface temperature (see text). Uncertainty in δ18Osw is related to the two estimates made by Lear et al. (2010; with and without taking into account the effect of ΔCO3= on Mg/Ca temperature).
REFERENCES:
Hauptvogel, D.W., Passchier, S., 2012. Early-Middle Miocene (17-14 Ma) Antarctic ice dynamics reconstructed from the heavy mineral provenance in the AND-2A drill core, Ross Sea, Antarctica. Global and Planetary Change 82-83, 38-50.
Lear, C.H., Mawbey, E.M., Rosenthal, Y., 2010. Cenozoic benthic foraminiferal Mg/Ca and Li/Ca records: Toward unlocking temperatures and saturation states. Paleoceanography, doi:10.1029/2009PA001880.
Lewis, A.R., Marchant, D.R., Ashworth, A.C., Hedenas, L., Hemming, S.R., Johnson, J.V., Leng, M.J., Machlus, M.L., Newton, A.E., Raine, J.I., Willenbring, J.K., Williams, M., Wolfe, A.P., 2008. Mid-Miocene cooling and the extinction of tundra in continental Antarctica. Proceedings of the National Academy of Science 105, 10676-10680.
Lewis, A.R., Marchant, D.R., Ashworth, A.C., Hemming, S.R., Machlus, M.L., 2007. Major middle Miocene global climate change: Evidence from East Antarctica and the Transantarctic Mountains. Geological Society of America Bulletin 119, 1449-1461.
Lewis, A.R., Marchant, D.R., Kowalewski, D.E., Baldwin, S.L., Webb, L.E., 2006. The age and origin of the Labyrinth, western Dry Valleys, Antarctica: Evidence for extensive middle Miocene subglacial floods and freshwater discharge to the Southern Ocean. Geology 34, 513-516.
Passchier, S., Browne, G., Field, B., Fielding, C.R., Krissek, L.A., Panter, K.S., Pekar, S.F., Team, A.-S.S., 2011. Early and middle Miocene Antarctic glacial history from the sedimentary facies distribution in the AND-2A drill hole, Ross Sea, Antarctica. Geological Society of America Bulletin 123, 2352-2365.
Rocchi, S., LeMasurier, W.E., Di Vincenzo, G., 2006. Oligocene to Holocene erosion and glacial history in Marie Byrd Land, West Antarctica, inferred from exhumation of the Dorrel Rock intrustive complex and from volcano morphologies. Geological Society of America Bulletin 118, 991-1005.
Sugden, D., Denton, G., 2004. Cenozoic landscape evolution of the Convoy Range to Mackay Glacier area, Transantarctic Mountains: Onshore to offshore synthesis. Geological Society of America Bulletin 116, 840-857.
Winkler, A., Wolf-Welling, T.C.W., Stattegger, K., Thiede, J., 2002. Clay mineral sedimentation in high northern latitude deep-sea basins since the Middle Miocene (ODP Leg 151, NAAG). Internation Journal of Earth Sciences 91, 133-148.


