Greenhouse climate
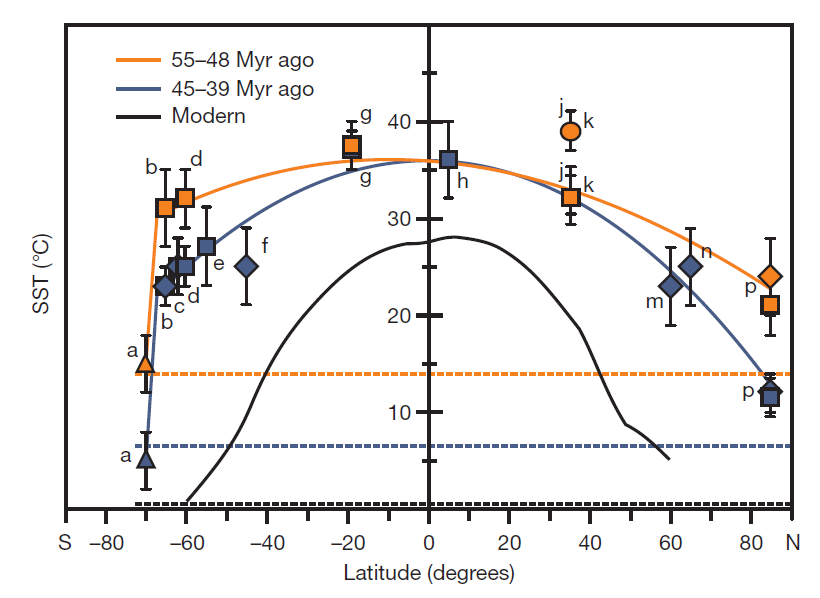
Over the last 65 million years the earth has existed under two different climatic regimes. During the early to mid Eocene (56-48 million years ago; Fig.1) the earth existed in a ‘greenhouse’ state characterised by extreme warmth at both high and low latitudes as a result of enhanced greenhouse gas concentrations in the atmosphere. The ice sheets we commonly associate with Antarctica and the Arctic were not present and in their place were subtropical forests and swampy wetland environments. As a result of widespread warming, the temperature gradient between equatorial and the polar regions was markedly reduced (Fig. 2) and this in particular has presented a major challenge to climate modellers who are unable to predict high sea surface temperatures in high latitudes even under hypergreenhouse (>2240ppm CO2) conditions)[1].
One way of resolving this problem is to compare model results with reconstructions based on various proxy indicators of climate. Up until now, this has been done in a very ad-hoc fashion, with different modelling groups using different proxy data, and different evaluation metrics. In a related project, (The EoMIP Eocene Modelling Intercomparison Project), project member Dan Lunt, aims to address these issues.
Fig 1a. Shows the concentration of atmospheric carbon dioxide (pCO2) through the early to mid-Eocene (shown in red) with values ranging from 750 to 4000 parts per million[2]. These measurements have been derived from a variety of different proxies, which when combined, help to build the most reliable record of past pCO2. However, there are still some key disagreements and a central aim of this proposal is to improve this CO2 record to better identify the role of CO2 in driving the warmth of the Early Eocene. Fig 1.b. shows the temperature of the deep ocean during the same time period. This record suggests that water near the sea floor was around 8 to 12°C. These measurements are extracted from the oxygen isotopic signature of sea-floor dwelling microfossils called foraminifera which record deep ocean temperature and ice volume.
Fig 2. Shows the Early and Middle Eocene pole-to-equator sea surface temperature gradient [3]. The orange line represents the early Eocene pole-to-equator temperature gradient and suggests that high-latitude regions were almost as warm as the low-latitudes. The blue line represents the mid Eocene pole-to-equator temperature gradient and suggests cooling at the poles while the tropics remain hot. The black line represents the modern pole-to-equator temperature gradient and exhibits cool polar regions and warm tropics.
______________________________
[1] Hollis, C.J., Handley, L., Crouch, E.M., Morgans, H.E.G., Baker, J.A., Creech, J., Collins, K.S., Gibbs, S.J., Huber, M., Schouten, S., Zachos, J.C., and Pancost, R.D., 2009, Tropical sea temperatures in the high-latitude South Pacific during the Eocene: Geology, v. 37, p. 99-102
[2] Zachos, J.C., Dickens, G.R., and Zeebe, R.E., 2008, An early Cenozoic perspective on greenhouse warming and carbon-cycle dynamics: Nature, v. 451, p. 279-283.
[3] Bijl, P.K., Schouten, S., Sluijs, A., Reichart, G.-J., Zachos, J.C., and Brinkhuis, H., 2009, Early Palaeogene temperature evolution of the southwest Pacific Ocean: Nature, v. 461, p. 776-779.
Links
Follow us on Twitter
Recent Posts
- In the News : What a three-million year fossil record tells us about climate sensitivity
- Past evidence confirms recent IPCC estimates of climate sensitivity
- Crucial new information about how the ice ages came about : PR & Podcast
- 2014 Sino-UK Coevolution of Life and the Planet Summer School
- Past and Future CO2 – Reconstructing atmospheric Carbon Dioxide


