CO2 and climate closely linked during the middle Miocene (11 to 17 million years ago)
by Gavin Foster, Carrie Lear and James Rae
The Miocene epoch spans a relatively long period of Earth’s history from 5 million to 23 million years ago. It contains the middle Miocene Climatic Optimum (from around 17 to 15 million years ago, also known as the MCO for short) – a period of global warmth (perhaps as much as 4-5 oC warmer than today) punctuating the overall cooling trend that has characterised the last 50 million years. Notably, the MCO is associated with (amongst other things) a smaller than modern Antarctic Ice Sheet. This is therefore a very useful period to study as it may serve as an analogue for our warm future, or at the very least, as a vital guide to how the Earth system functions when it’s warmer than today.
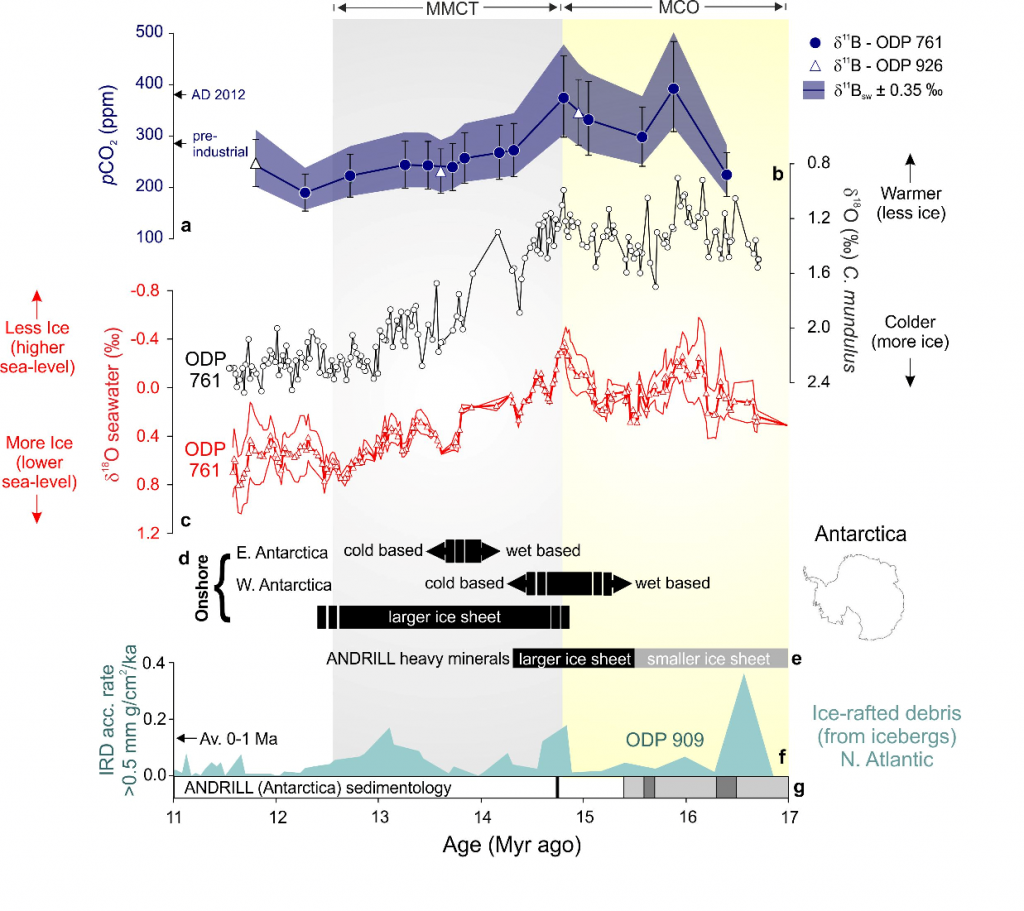
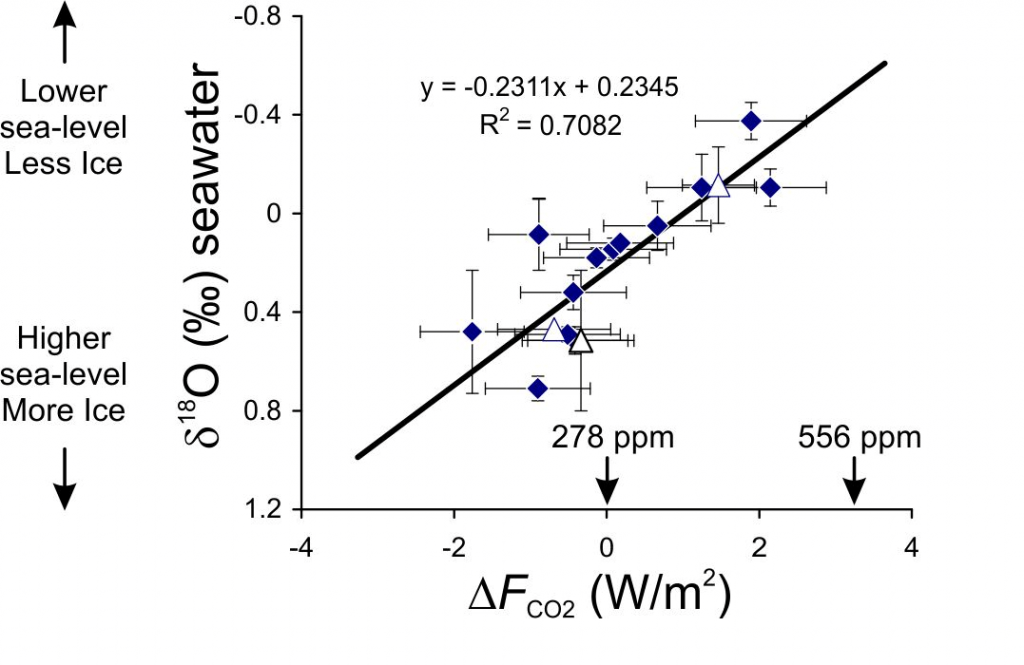
The most obvious driver of warmth during the MCO would be higher CO2 than the pre-industrial period (i.e. >280 ppm). However, much of the available proxy information does not support this and the middle Miocene is thought to be a time period when other factors control climate independent of CO2 – such as ocean circulation and mountain uplift. In a recent paper, by Gavin Foster, Carrie Lear and James Rae published in Earth and Planetary Science Letters , a new boron isotope-based CO2 record is presented that, in contrast to this long standing view, shows a remarkable agreement with indicators of the thermal state of the Earth System during the middle Miocene, for instance, the oxygen isotopic composition of benthic foraminifera (which reflect ice volume and bottom water temperature) and the state of the Antarctic Ice Sheet (Figure 1). When the temperature component of the oxygen isotope record is isolated and corrected for, the record of ice volume (the amount of ice stored on land) generated appears tightly correlated to CO2 (see Figures 1 & 2). This suggests that CO2 is driving the climate system during the middle Miocene and the climate system and the cryosphere are responding in a relatively linear fashion to CO2 forcing – e.g. when CO2 goes up the climate warms and the ice sheets melt and vice versa.
Whilst this observation provides further support for the importance of CO2in driving natural climate change, it does leave us with a couple of conundrums. Firstly, it is known from a number of sources that the Antarctic was much warmer during the MCO (e.g., see My oh Miocene!) and the Antarctic Ice Sheet (AIS) retreated behind the current ice margin at this time. Our new data suggests that it did this at a similar level of CO2 (~350-400 ppm) to that associated with its regrowth at the end of the MCO (Figure 1). According to ice sheet models this shouldn’t happen, because the AIS is so cold, bright and elevated, that a higher CO2 (and hence more warmth) is required to melt it than is required to form it in the first place (a process known as hysteresis). The answer to this conundrum is that it is likely some portion of the AIS is more mobile than the models are able to simulate (e.g. those portions, such as the Aurora subglacial basin, currently below sea-level, see http://www.antarctica.ac.uk//bas_research/data/access/bedmap/examples/bed10.gif). This of course has potentially worrying consequences for our future as we approach Miocene-like CO2 levels in the coming years. Because ice sheets are inherently sluggish, it will take many 100s of years for the AIS to reach equilibrium with modern CO2 levels, but when it does we may also experience Miocene-like sea-levels (>20 m higher than present).
Secondly, even after the MCO, when our new record suggests CO2 dropped to lower than pre-industrial values (280 ppm; Figure 1), the Miocene is thought to be significantly warmer than the pre-industrial. In particular, several studies (including this recent one in Nature) indicate that climate cooled from the Late Miocene to the Pliocene (11 to 2.5 million years ago) – and if CO2 is already at low values, what is driving this cooling? Unfortunately CO2 records for the Late Miocene to Pliocene are sparse so we are not currently able to identify exactly what CO2 is doing during this period. This means it is still possible that CO2 and climate are decoupled for part of the Miocene. However we are in the process of generating some new boron based CO2 records for this crucial period so we may know the answer in the coming months – so watch this space!
FIGURES
CAPTION FIGURE 1. (a) Middle Miocene pCO2 (Foster et al., 2012), (b) benthic foraminiferal δ18O at ODP 761 (Lear et al., 2010) – this parameter reflects both the temperature of the deep water the foraminifera grew in and the amount of ice on land (ice volume), (c) δ18O of seawater (δ18Osw) reconstructed at ODP 761 (Lear et al., 2010) – this parameter is just ice-volume. (d) schematic summary of shore based reconstructions of the Antarctic Ice Sheet with the length of the black bands incorporating both dating uncertainties and the likely duration of events (Sugden and Denton, 2004; Rocchi et al., 2006; Lewis et al., 2006; Lewis et al., 2007; Lewis et al., 2008), (e) AIS size based on heavy mineral assemblage in the AND-2A drill hole, Ross Sea (Hauptvogel and Passhier, 2012), (f) accumulation rate of debris delivered to the North Atlantic by ice bergs (ice rafted debris; IRD) >0.5 mm in size (from Winkler et al., 2002) and (g) schematic Antarctic glacial history based on the results from the AND-2A drill hole, Ross Sea (Passchier et al., 2011). For (a) symbols are as for Figure 8 and for (b) and (c) symbols are as for Figure 5. Also shown in (g) is the average accumulation rate of IRD >0.5 mm (g/cm2/ka) at ODP Site 909 during the last 1 million years (0.13 g/cm2/ka). In (g) the white fill denotes time periods of expanded, cold-based AIS with advance beyond the modern grounding line beginning at ~14.7 Ma (black line) coincident with the start of the MMCT. Periods of polythermal conditions and a reduced AIS compared to the modern are shown as light grey and periods of significant retreat as dark grey (modified from Passchier et al., 2011).
CAPTION FIGURE 2. . The relationship between δ18Osw (which represents the amount of ice stored on land – ice volume) and climate forcing (δFCO2 = 5.35 * ln[CO2/278] W/m2) by pCO2. In each plot data from ODP 761 is shown as filled blue diamonds and ODP 926 as open blue triangles. Error bars are the sum of the analytical uncertainty in d11B, the uncertainty in TA and sea surface temperature (see text). Uncertainty in δ18Osw is related to the two estimates made by Lear et al. (2010; with and without taking into account the effect of ΔCO3= on Mg/Ca temperature).
REFERENCES:
Hauptvogel, D.W., Passchier, S., 2012. Early-Middle Miocene (17-14 Ma) Antarctic ice dynamics reconstructed from the heavy mineral provenance in the AND-2A drill core, Ross Sea, Antarctica. Global and Planetary Change 82-83, 38-50.
Lear, C.H., Mawbey, E.M., Rosenthal, Y., 2010. Cenozoic benthic foraminiferal Mg/Ca and Li/Ca records: Toward unlocking temperatures and saturation states. Paleoceanography, doi:10.1029/2009PA001880.
Lewis, A.R., Marchant, D.R., Ashworth, A.C., Hedenas, L., Hemming, S.R., Johnson, J.V., Leng, M.J., Machlus, M.L., Newton, A.E., Raine, J.I., Willenbring, J.K., Williams, M., Wolfe, A.P., 2008. Mid-Miocene cooling and the extinction of tundra in continental Antarctica. Proceedings of the National Academy of Science 105, 10676-10680.
Lewis, A.R., Marchant, D.R., Ashworth, A.C., Hemming, S.R., Machlus, M.L., 2007. Major middle Miocene global climate change: Evidence from East Antarctica and the Transantarctic Mountains. Geological Society of America Bulletin 119, 1449-1461.
Lewis, A.R., Marchant, D.R., Kowalewski, D.E., Baldwin, S.L., Webb, L.E., 2006. The age and origin of the Labyrinth, western Dry Valleys, Antarctica: Evidence for extensive middle Miocene subglacial floods and freshwater discharge to the Southern Ocean. Geology 34, 513-516.
Passchier, S., Browne, G., Field, B., Fielding, C.R., Krissek, L.A., Panter, K.S., Pekar, S.F., Team, A.-S.S., 2011. Early and middle Miocene Antarctic glacial history from the sedimentary facies distribution in the AND-2A drill hole, Ross Sea, Antarctica. Geological Society of America Bulletin 123, 2352-2365.
Rocchi, S., LeMasurier, W.E., Di Vincenzo, G., 2006. Oligocene to Holocene erosion and glacial history in Marie Byrd Land, West Antarctica, inferred from exhumation of the Dorrel Rock intrustive complex and from volcano morphologies. Geological Society of America Bulletin 118, 991-1005.
Sugden, D., Denton, G., 2004. Cenozoic landscape evolution of the Convoy Range to Mackay Glacier area, Transantarctic Mountains: Onshore to offshore synthesis. Geological Society of America Bulletin 116, 840-857.
Winkler, A., Wolf-Welling, T.C.W., Stattegger, K., Thiede, J., 2002. Clay mineral sedimentation in high northern latitude deep-sea basins since the Middle Miocene (ODP Leg 151, NAAG). Internation Journal of Earth Sciences 91, 133-148.
Links
Follow us on Twitter
Recent Posts
- In the News : What a three-million year fossil record tells us about climate sensitivity
- Past evidence confirms recent IPCC estimates of climate sensitivity
- Crucial new information about how the ice ages came about : PR & Podcast
- 2014 Sino-UK Coevolution of Life and the Planet Summer School
- Past and Future CO2 – Reconstructing atmospheric Carbon Dioxide


